In-silico perturbation predictions in murine embryos (sci-RNA-seq3)
RegVelo is a generative model coupling cellular dynamics with regulatory networks. For a trained RegVelo model, we can perform in silico counterfactual inference upon perturbations of a TF in the regulatory network. For a trained RegVelo model, we perturb a TF by ignoring all its regulatory effects and generate the perturbed velocity vector field (RegVelo paper Figure 2a; Methods). In this notebook, we will go through the steps of in-silico perturbation of a selected transcription factor (TF) and quantify the perurbation effects on the terminal states.
This tutorial uses a subset of the data from Qiu, C. et al, 2024.
In this work, the authors profiled 12.4 million nuclei from 83 murine embryos at different stages during gestation (from late gastrulation to birth). The subset used in this tutorial focuses on cells involved in the neural crest development.
Note
For this tutorial, petsc4py and slepc4py are needed to run CellRank’s estimators.compute_macrostates using the default method. You can install it with pip install petsc4py slepc4py.
Library import
import numpy as np
import pandas as pd

import matplotlib.pyplot as plt

import cellrank as cr
import scanpy as sc
import scvelo as scv
import scvi
from regvelo import REGVELOVI

import regvelo as rgv

import torch
General settings
scvi.settings.seed = 0
scv.settings.verbosity = 3
cr.settings.verbosity = 2
%matplotlib inline
plt.rcParams["svg.fonttype"] = "none"
scv.settings.set_figure_params("scvelo", dpi=80, transparent=True, fontsize=14, color_map="viridis")
Load data
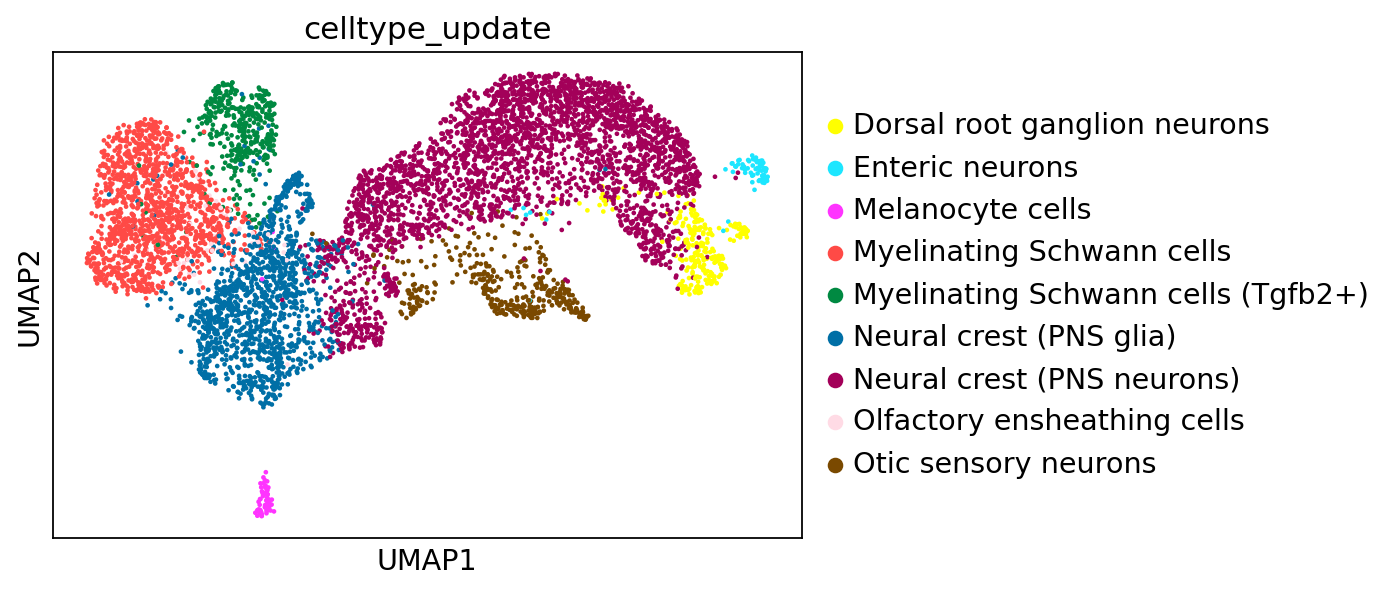
Here, we load the murine neural crest dataset described above. The dataset contains 6788 cells and 1164 genes. Cell-type annotation can be assessed in the .obs['celltype_update'] layer and includes Neural crest (PNS glia), Otic sensory neurons, Myelinating Schwann cells, Neural crest (PNS neurons), Olfactory ensheathing cells, Myelinating Schwann cells (Tgfb2+), Dorsal root ganglion neurons, Melanocyte cells, and Enteric neurons. The list of TFs can be assessed via .var['TF'].
adata_baseline = rgv.datasets.murine_nc(data_type = "preprocessed")
adata_baseline
AnnData object with n_obs × n_vars = 6788 × 1164
    obs: 'nCount_RNA', 'nFeature_RNA', 'cell_id', 'UMI_count', 'gene_count', 'major_trajectory', 'celltype_update', 'UMAP_1', 'UMAP_2', 'UMAP_3', 'UMAP_2d_1', 'UMAP_2d_2', 'terminal_state', 'nCount_intron', 'nFeature_intron', 'initial_size_unspliced', 'initial_size_spliced', 'initial_size', 'n_counts'
    var: 'vf_vst_counts_mean', 'vf_vst_counts_variance', 'vf_vst_counts_variance.expected', 'vf_vst_counts_variance.standardized', 'vf_vst_counts_variable', 'vf_vst_counts_rank', 'var.features', 'var.features.rank', 'gene_count_corr', 'means', 'dispersions', 'dispersions_norm', 'highly_variable', 'velocity_genes', 'TF'
    uns: 'celltype_update_colors', 'log1p', 'neighbors', 'network', 'regulators', 'skeleton', 'targets', 'terminal_state_colors', 'umap'
    obsm: 'X_pca', 'X_umap'
    layers: 'Ms', 'Mu', 'spliced', 'unspliced'
    obsp: 'connectivities', 'distances'
sc.pl.umap(adata_baseline,
           color="celltype_update"
          )
TF = adata_baseline.var_names[adata_baseline.var["TF"]]
Velocity pipeline
Prior GRN information is inferred using pySCENIC and is saved in .uns['skeleton']. Note that for the RegVelo pipeline, rows of the prior GRN indicate targets, while columns indiate regulators.
We save the trained model, as it will later be used in RegVelo’s in_silico_block_simulation for TF perturbation.
W = adata_baseline.uns["skeleton"].copy()
W = torch.tensor(np.array(W)).int()
W = W.T
REGVELOVI.setup_anndata(adata_baseline, spliced_layer="Ms", unspliced_layer="Mu")
vae = REGVELOVI(adata_baseline, W=W, regulators=TF)
vae.train()
Epoch 1500/1500: 100%|██████████| 1500/1500 [40:50<00:00,  2.30s/it, v_num=1]
Epoch 1500/1500: 100%|██████████| 1500/1500 [40:50<00:00,  1.63s/it, v_num=1]
vae.save("regvelo_model")
Next, we add the inference results to adata_baseline using rgv.tl.set_output function.
rgv.tl.set_output(adata_baseline, vae, n_samples=30, batch_size=adata_baseline.n_obs)
adata_baseline
AnnData object with n_obs × n_vars = 6788 × 1164
    obs: 'nCount_RNA', 'nFeature_RNA', 'cell_id', 'UMI_count', 'gene_count', 'major_trajectory', 'celltype_update', 'UMAP_1', 'UMAP_2', 'UMAP_3', 'UMAP_2d_1', 'UMAP_2d_2', 'terminal_state', 'nCount_intron', 'nFeature_intron', 'initial_size_unspliced', 'initial_size_spliced', 'initial_size', 'n_counts'
    var: 'vf_vst_counts_mean', 'vf_vst_counts_variance', 'vf_vst_counts_variance.expected', 'vf_vst_counts_variance.standardized', 'vf_vst_counts_variable', 'vf_vst_counts_rank', 'var.features', 'var.features.rank', 'gene_count_corr', 'means', 'dispersions', 'dispersions_norm', 'highly_variable', 'velocity_genes', 'TF', 'fit_beta', 'fit_gamma', 'fit_scaling'
    uns: 'celltype_update_colors', 'log1p', 'neighbors', 'network', 'regulators', 'skeleton', 'targets', 'terminal_state_colors', 'umap', '_scvi_uuid', '_scvi_manager_uuid'
    obsm: 'X_pca', 'X_umap'
    layers: 'Ms', 'Mu', 'spliced', 'unspliced', 'velocity', 'latent_time_velovi', 'fit_t'
    obsp: 'connectivities', 'distances'
CellRank’s cell fate predictions on vector fields inferred from baseline trained RegVelo model
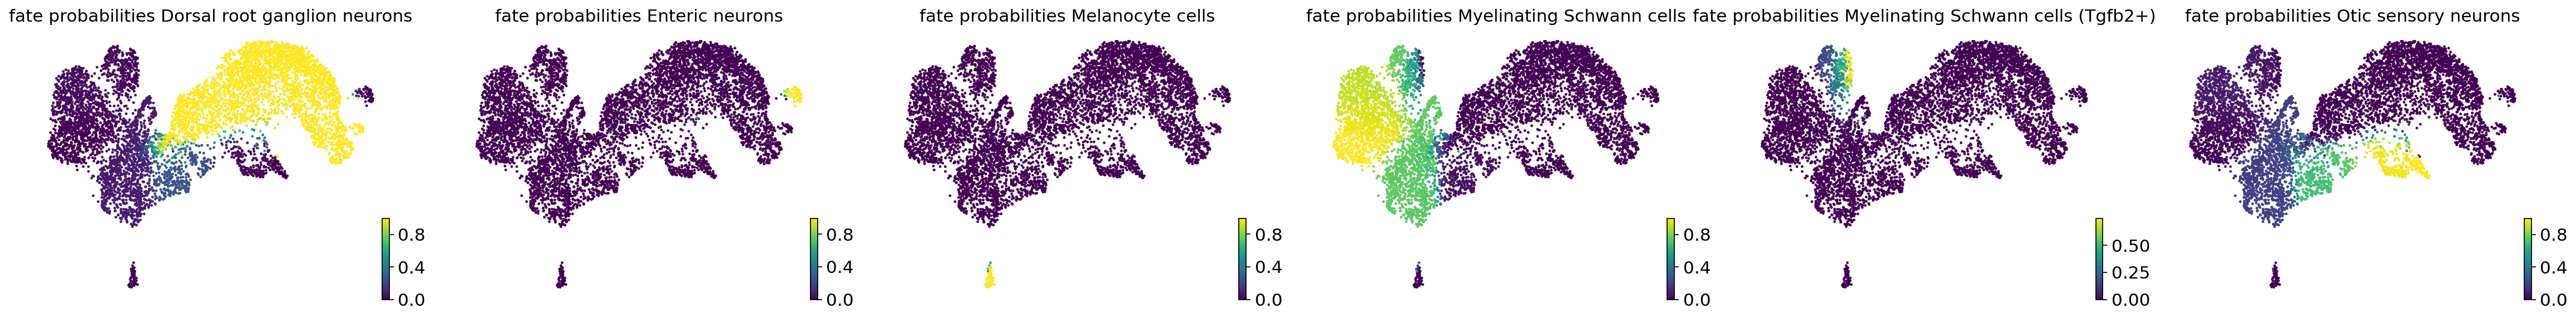
We first define the set of terminal states involving Dorsal root ganglion neurons, Enteric neurons, Melanocyte cells, Myelinating Schwann cells, Myelinating Schwann cells (Tgfb2+), and Otic sensory neurons. In the following, we use CellRank to predict cell fate probabilities towards the set of terminal states using the VelocityKernel from CellRank.
TERMINAL_STATE = ['Dorsal root ganglion neurons','Enteric neurons',
                  'Melanocyte cells', 'Myelinating Schwann cells',
                  'Myelinating Schwann cells (Tgfb2+)',
                  'Otic sensory neurons']
vk = cr.kernels.VelocityKernel(adata_baseline).compute_transition_matrix()
vk.write_to_adata()
estimator = cr.estimators.GPCCA(vk)
estimator.compute_macrostates(n_states=10, cluster_key="celltype_update")
GPCCA[kernel=VelocityKernel[n=6788], initial_states=None, terminal_states=None]
estimator.set_terminal_states(TERMINAL_STATE)
estimator.compute_fate_probabilities(solver = "direct")
estimator.plot_fate_probabilities(same_plot=False, basis="umap")
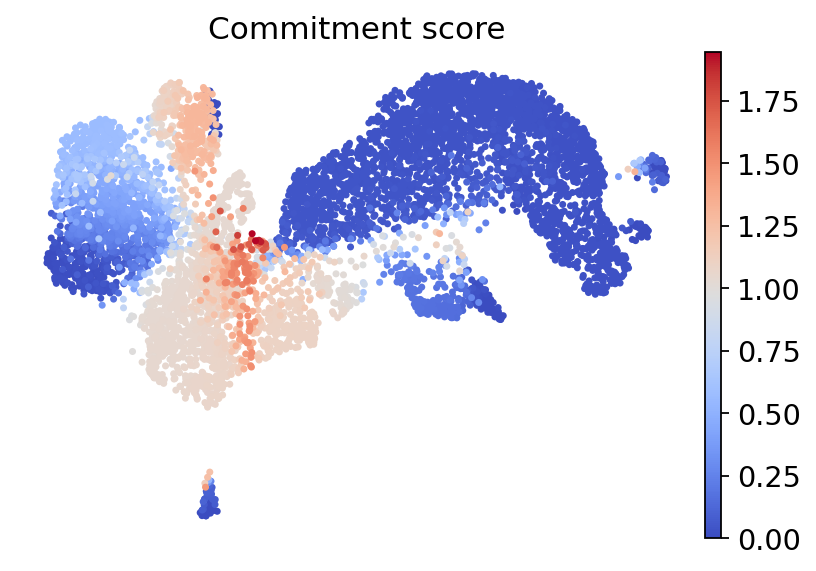
For each cell, we further use the function rgv.pl.commitment_score to compute and plot its cell fate commitment score, which is defined as the entropy of the cell fate probability distribution, where commited cells have a lower commitment score.
rgv.pl.commitment_score(adata=adata_baseline,
                        lineage_key="lineages_fwd",
                        frameon=False,
                        s=40,
                        cmap="coolwarm",
                        title="Commitment score"
                       )
Perturb a TF in the regulatory network
In the following, we consider four classical TFs, i.e. Mitf, Sox10, Pou4f1, and Neurod1, that are essential in lineage specification during neural crest development. Mitf is involved in the development of many cell lineages including melanocyte cells (Hershey, C.L. and Fisher, D.E., 2004), the TF Sox10 plays an important role in differentiation of peripheral glial cells (Britsch, S. 2001), Pou4f1, also known as Brn3a, is particularly involved in the development of retinal ganglin cells and sensory neurons (Gerrero, M.R. et al, 1993), and Neurod1 plays an important role in terminal neuronal differntiation (Boutin, C., 2009).
TF_candidate = ["Mitf","Sox10","Pou4f1","Neurod1"]
Here, we specify the path to the baseline trained RegVelo model. For each of the TFs in TF_candidate, we use RegVelo’s in_silico_block_simulation function to remove the target TF’s regulatory effects of the baseline trained RegVelo model to compute a perturbed velocity field.
MODEL = "regvelo_model"
adata_perturb_dict = {}
for TF in TF_candidate:
    adata_perturb, reg_vae_perturb =  rgv.tl.in_silico_block_simulation(model=MODEL,
                                                                        adata=adata_baseline,
                                                                        TF=TF,
                                                                        cutoff=0)
    adata_perturb_dict[TF] = adata_perturb
INFO     File regvelo_model/model.pt already downloaded
INFO     File regvelo_model/model.pt already downloaded
INFO     File regvelo_model/model.pt already downloaded
INFO     File regvelo_model/model.pt already downloaded
For each of the TFs, we quantify the perturbation effects on cell fate decisions by passing the perturbed velocity estimates to
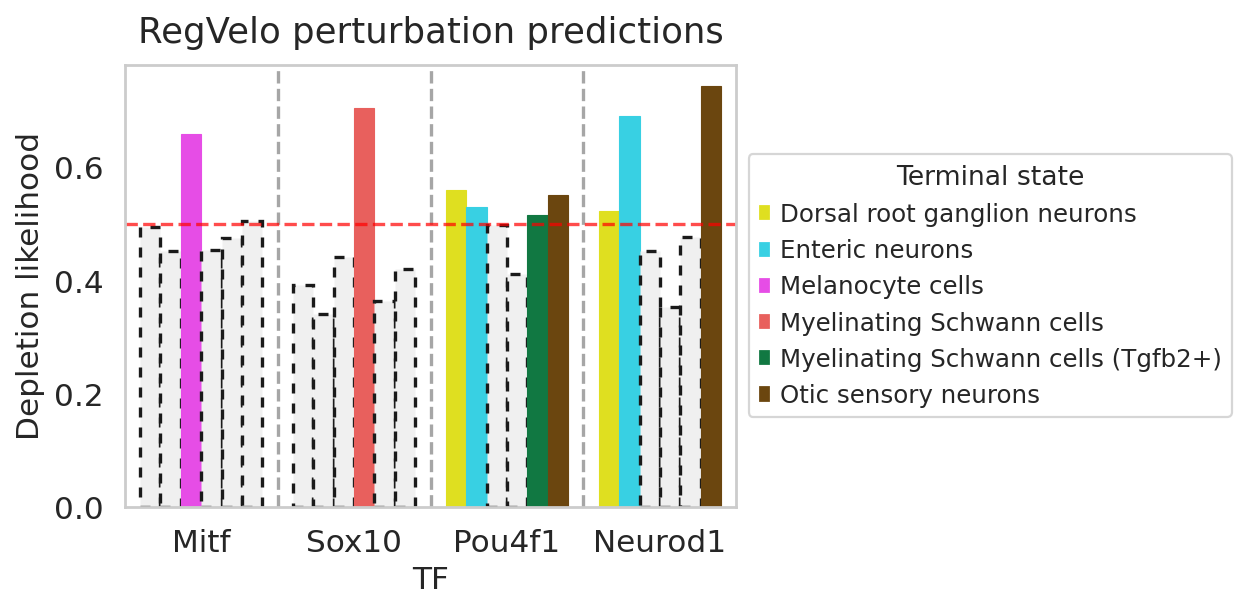
CellRank’s functions using the VelocityKernel in CellRank. In addition, we compute the depletion score for each terminal state using either the \(t\)-test statistics (method='t-statistics') or the normalized Mann-Whitney \(U\) statistics (method='likelihood'), which is the default method. We can then plot the depletion scores for each TF for each terminal state using the rgv.pl.depletion_score function.
ct_indices = {
    ct: adata_baseline.obs["term_states_fwd"][adata_baseline.obs["term_states_fwd"] == ct].index.tolist()
    for ct in TERMINAL_STATE}

# Computing states transition probability for perturbed systems
for TF, adata_target_perturb in adata_perturb_dict.items():
    vkp = cr.kernels.VelocityKernel(adata_target_perturb).compute_transition_matrix()
    estimator = cr.estimators.GPCCA(vkp)
    estimator.compute_macrostates(n_states=10, cluster_key='celltype_update')
    estimator.set_terminal_states(ct_indices)
    estimator.compute_fate_probabilities(solver="direct")

    adata_perturb_dict[TF] = adata_target_perturb
df = rgv.mt.cellfate_perturbation(perturbed=adata_perturb_dict, baseline=adata_baseline, terminal_state=TERMINAL_STATE)
df
| Depletion likelihood | p-value | FDR adjusted p-value | Terminal state | TF | |
|---|---|---|---|---|---|
| 0 | 0.494434 | 8.693252e-01 | 1.000000e+00 | Dorsal root ganglion neurons | Mitf |
| 1 | 0.452041 | 1.000000e+00 | 1.000000e+00 | Enteric neurons | Mitf |
| 2 | 0.658523 | 7.365109e-225 | 4.419065e-224 | Melanocyte cells | Mitf |
| 3 | 0.454590 | 1.000000e+00 | 1.000000e+00 | Myelinating Schwann cells | Mitf |
| 4 | 0.476028 | 9.999993e-01 | 1.000000e+00 | Myelinating Schwann cells (Tgfb2+) | Mitf |
| 5 | 0.505041 | 1.545146e-01 | 4.635437e-01 | Otic sensory neurons | Mitf |
| 0 | 0.391604 | 1.000000e+00 | 1.000000e+00 | Dorsal root ganglion neurons | Sox10 |
| 1 | 0.341692 | 1.000000e+00 | 1.000000e+00 | Enteric neurons | Sox10 |
| 2 | 0.442346 | 1.000000e+00 | 1.000000e+00 | Melanocyte cells | Sox10 |
| 3 | 0.705020 | 0.000000e+00 | 0.000000e+00 | Myelinating Schwann cells | Sox10 |
| 4 | 0.363893 | 1.000000e+00 | 1.000000e+00 | Myelinating Schwann cells (Tgfb2+) | Sox10 |
| 5 | 0.420816 | 1.000000e+00 | 1.000000e+00 | Otic sensory neurons | Sox10 |
| 0 | 0.559560 | 1.402962e-33 | 8.417773e-33 | Dorsal root ganglion neurons | Pou4f1 |
| 1 | 0.530516 | 3.675556e-10 | 7.351111e-10 | Enteric neurons | Pou4f1 |
| 2 | 0.497448 | 6.967353e-01 | 8.360824e-01 | Melanocyte cells | Pou4f1 |
| 3 | 0.412249 | 1.000000e+00 | 1.000000e+00 | Myelinating Schwann cells | Pou4f1 |
| 4 | 0.515823 | 7.036213e-04 | 1.055432e-03 | Myelinating Schwann cells (Tgfb2+) | Pou4f1 |
| 5 | 0.551224 | 2.388410e-25 | 7.165231e-25 | Otic sensory neurons | Pou4f1 |
| 0 | 0.523037 | 1.667213e-06 | 3.334426e-06 | Dorsal root ganglion neurons | Neurod1 |
| 1 | 0.690561 | 0.000000e+00 | 0.000000e+00 | Enteric neurons | Neurod1 |
| 2 | 0.453098 | 1.000000e+00 | 1.000000e+00 | Melanocyte cells | Neurod1 |
| 3 | 0.354083 | 1.000000e+00 | 1.000000e+00 | Myelinating Schwann cells | Neurod1 |
| 4 | 0.476769 | 9.999986e-01 | 1.000000e+00 | Myelinating Schwann cells (Tgfb2+) | Neurod1 |
| 5 | 0.744053 | 0.000000e+00 | 0.000000e+00 | Otic sensory neurons | Neurod1 |
rgv.pl.cellfate_perturbation(adata=adata_baseline,
                             df=df,
                             fontsize=14,
                             figsize=(8, 4),
                             legend_loc='center left',
                             legend_bbox=(1.02, 0.5),
                             color_label="celltype_update")
Perturbation effect on a single-cell level
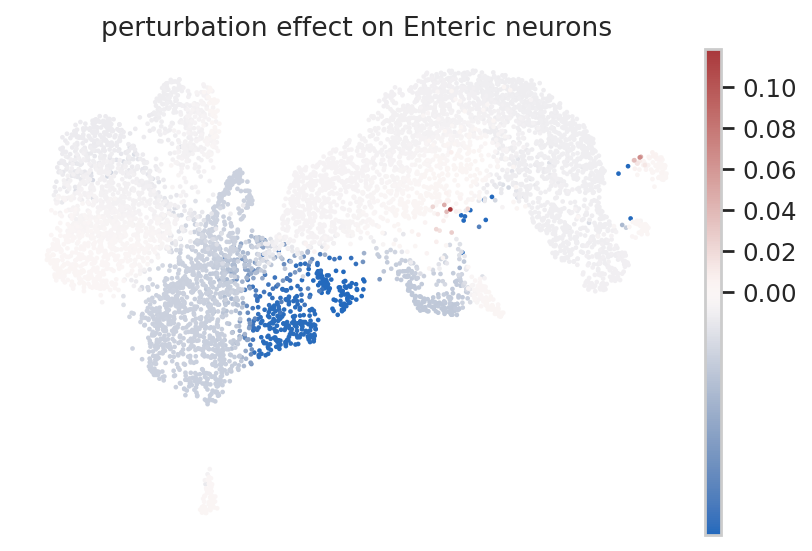
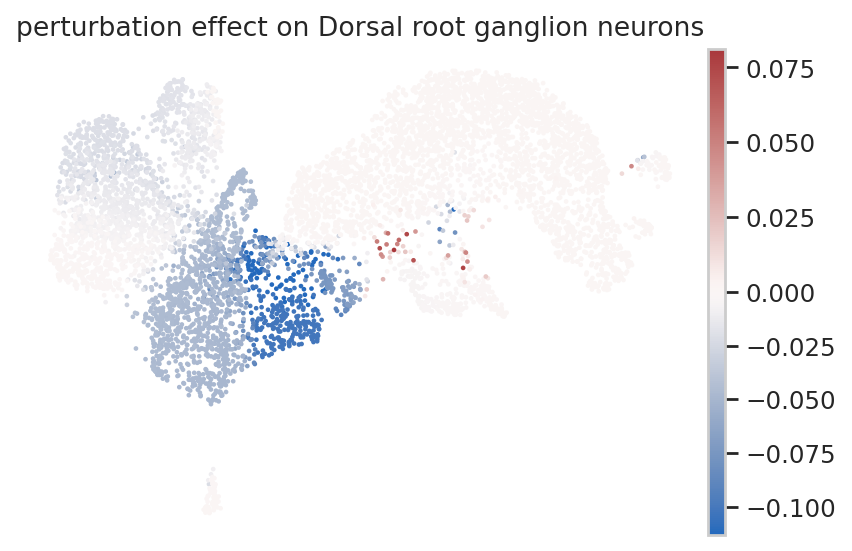
To study the perturbation effect of a TF on a single-cell level, we use the rgv.tl.perturbation_effect function, which computes the difference of the cell fate probabilities (estimated from perturbed and baseline velocity fields) towards the terminal states for each cell. Negative scores correspond to a decrease in the cell’s fate probability towards a selected terminal state. Consider for instance the TF Neurod1.
TF = "Neurod1"
adata_perturb = adata_perturb_dict[TF]
adata_baseline = rgv.tl.perturbation_effect(adata_perturb=adata_perturb,
                                            adata=adata_baseline,
                                            terminal_state=TERMINAL_STATE)
The results are saved in .obs.
adata_baseline
AnnData object with n_obs × n_vars = 6788 × 1164
    obs: 'nCount_RNA', 'nFeature_RNA', 'cell_id', 'UMI_count', 'gene_count', 'major_trajectory', 'celltype_update', 'UMAP_1', 'UMAP_2', 'UMAP_3', 'UMAP_2d_1', 'UMAP_2d_2', 'terminal_state', 'nCount_intron', 'nFeature_intron', 'initial_size_unspliced', 'initial_size_spliced', 'initial_size', 'n_counts', 'macrostates_fwd', 'term_states_fwd', 'term_states_fwd_probs', 'commitment_score', 'perturbation effect on Dorsal root ganglion neurons', 'perturbation effect on Enteric neurons', 'perturbation effect on Melanocyte cells', 'perturbation effect on Myelinating Schwann cells', 'perturbation effect on Myelinating Schwann cells (Tgfb2+)', 'perturbation effect on Otic sensory neurons'
    var: 'vf_vst_counts_mean', 'vf_vst_counts_variance', 'vf_vst_counts_variance.expected', 'vf_vst_counts_variance.standardized', 'vf_vst_counts_variable', 'vf_vst_counts_rank', 'var.features', 'var.features.rank', 'gene_count_corr', 'means', 'dispersions', 'dispersions_norm', 'highly_variable', 'velocity_genes', 'TF', 'fit_beta', 'fit_gamma', 'fit_scaling'
    uns: 'celltype_update_colors', 'log1p', 'neighbors', 'network', 'regulators', 'skeleton', 'targets', 'terminal_state_colors', 'umap', '_scvi_uuid', '_scvi_manager_uuid', 'T_fwd_params', 'schur_matrix_fwd', 'eigendecomposition_fwd', 'macrostates_fwd_colors', 'coarse_fwd', 'term_states_fwd_colors'
    obsm: 'X_pca', 'X_umap', 'schur_vectors_fwd', 'macrostates_fwd_memberships', 'term_states_fwd_memberships', 'lineages_fwd'
    layers: 'Ms', 'Mu', 'spliced', 'unspliced', 'velocity', 'latent_time_velovi', 'fit_t'
    obsp: 'connectivities', 'distances', 'T_fwd'
sc.pl.umap(adata_baseline,
           color="perturbation effect on Dorsal root ganglion neurons",
           frameon=False,
           vcenter=0,
           cmap="vlag",
           vmin="p1")
sc.pl.umap(adata_baseline,
           color="perturbation effect on Enteric neurons",
           frameon=False,
           vcenter=0,
           cmap="vlag",
           vmin ="p1")